For each scenario, make a new slide in keynote and create a graph describing the motion.

|

|
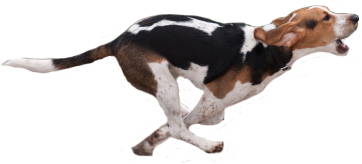
Scenario #1 (Distance vs Time)
A dog runs 5 miles away from home. He then stops for 5 minutes and stares at a fire hydrant. He then gets bored and runs back home.


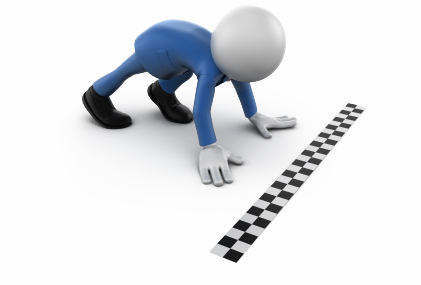
Scenario #2 (Distance vs time)
A man runs from starting line to halfway point. He then stops to take a break. After this he runs back to the starting line because he forgot his water bottle. He then completes the race and passes the finish line.


Scenario #3 (Distance vs time)
Create your own distance vs time graph and story
Scenario #4 (speed vs time)
A boat speeds up from zero mile/hour to 30 miles/hour. When he gets to 30 miles/hour he slams on the break because his friend fell out of the boat.


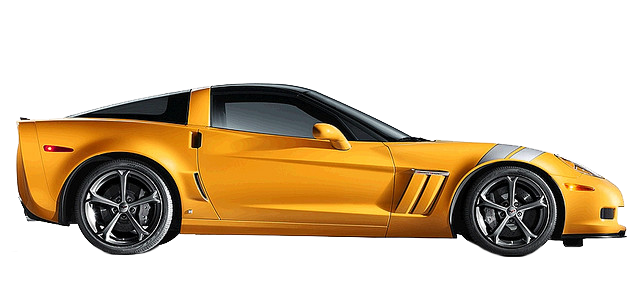
Scenario #5 (speed vs time)
A car starts at a stop sign. He then accelerates to 60 miles per hour. He stays at a constant speed of 60 miles per hour for a while. After he sees a cop, he slams on the breaks and slows down to 40 miles per hour. He stays at this speed until the cops starts to follow his. Once the cop turns on his lights, the car stops and gets a speeding ticket.


Scenario #6 (Speed vs Time)
Create your own speed vs time graph and story!
